 OGame
Opening the charts
The charts open from the Charts entry in the OGame left menu and are part of premium. They show the data the bot records by reading combat and expedition reports: message reading must be on and the bot running. The bot also saves attacks and expeditions every 30 minutes, so the expedition charts update without opening the Expeditions tab of the messages.
Period and figures
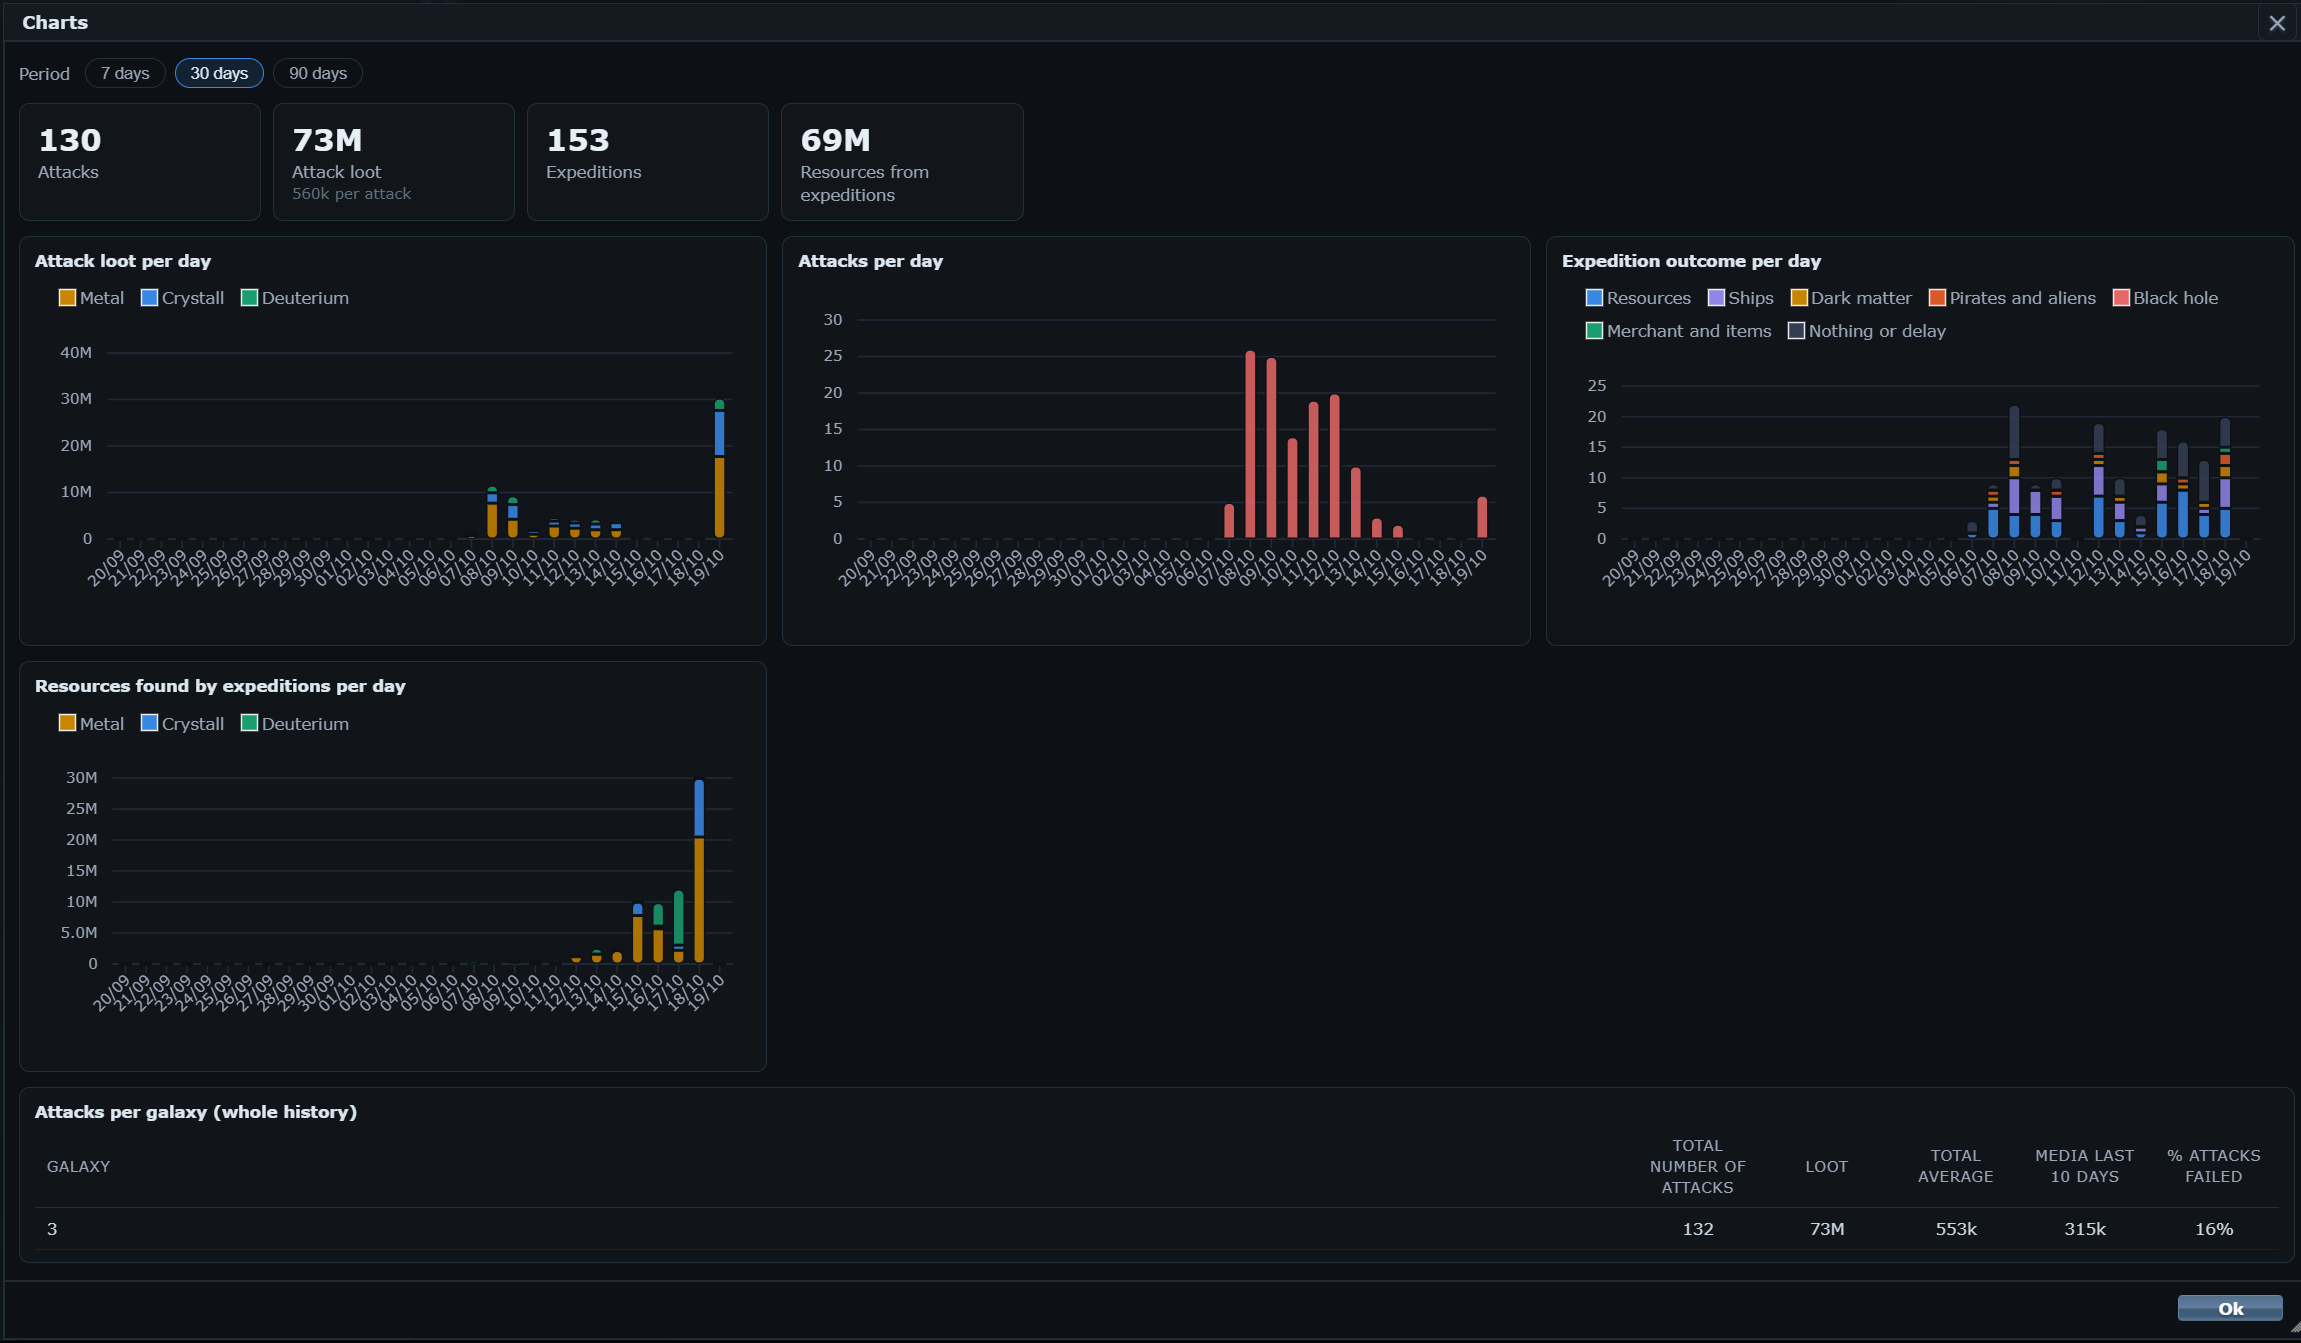
Everything is in one window. At the top choose the Period: 7, 30 or 90 days. Below are the figures for the period: Attacks, Attack loot with the average per attack, Expeditions and Resources from expeditions.
Attack charts
Attack loot per day
Attacks per day
Expedition charts
Expedition outcome per day
Resources found by expeditions per day
The summary figures are also in the Expedition menu, Show statistics button.
Attacks per galaxy
At the bottom a table sums up the whole attack history, one row per galaxy: number of attacks, loot, overall average, average of the last 10 days and percentage of failed attacks.
Hover over a bar to read that day's values, series by series. If a chart has no data for the chosen period, it says so.